

Change in the London residential markets
I
n
economic
terms,
the
value
of
residences
in
an
area
is
a
function
of
both
demand
and
supply
and,
therefore,
changes
in
these
can
be
used
as
proxies
for
the
trend
in
values.
While,
in
theory,
supply
and
demand
may
appear
to
be
just
two
sides
of
the
same
housing
market
coin,
there
is
an
important
distinction
between
the
two.
Demand
applies
to
a
requirement
relating
to
the
whole
of
the
existing
housing
stock
whereas
supply
only
applies
to
the
marginal
addition
to
the
stock
arising
from
construction
(and
losses
from
demolition).
Because
that
marginal
change
in
stock
is
typically
very
small
-
it
may
only
be
1%
per
annum
-
the
impact
of
supply
on
prices
is
really
only
seen
in
the
long-term.
Changes
in
the
sentiment
of
purchasers
(the
perpensity
to
consume
in
economic
terms)
can,
and
do,
have
an
immediate
effect,
and
it
is
this
that
drives
prices
in
the
short-term.
Most
typically,
such
short-term
changes
are
the
result
of
financial
changes,
such
as
varying
interest
rates,
employment
(job
opportunities)
rates
rising
or
falling,
inflation
rising
or
falling,
and
economic
growth
influencing wealth growth and confidence.
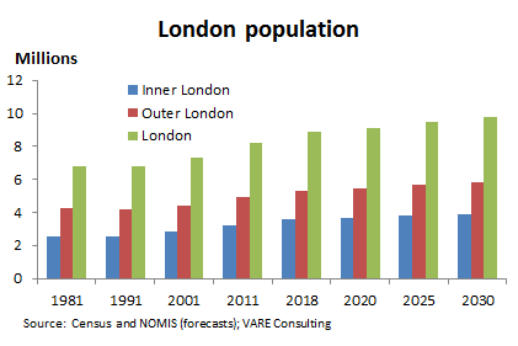
With
a
population
of
some
9m
(estimated
2020),
London
is
the
largest
city
in
Europe.
Since
1988,
its
population
has
been
rising,
fuelled
by
an
influx
of
domestic
and
foreign
graduates
(looking
for
their
first
post-
graduate
job),
immigrants
from
outside
the
EU,
and
by
EU
professionals
(attracted
by
the
the
biggest
financial
centre
in
Europe).
This
has
generated
incredible
demand
for
housing,
raising
house
prices
and
rents,
encouraging
much
new
high
rise
and
other
development,
and
increasing
‘densification’
in
the
existing
stock.
But
to
put
that
into
context,
in
1939,
its
population
was
8.6m,
declining
to
a
low
in
the
1980s
before
it
grew
to
reach
a
new
peak
in
2018
of
8.9m.
The
population
growth
rate
has
been
accelerating
in
recent
decades,
from
0.7% pa in the 1990s, to 1.7% pa in the 2000s and 1.8% pa in the 2001-2018 period.
Until
the
pandemic,
the
consensus
forecasts
were
for
slightly
under
1%
pa
population
growth
over
the
next
10
years,
as
is
illustrated
in
the
chart
above.
Indeed,
it
is
probable
that
the
population
growth
in
2019
and
2020
has
already
shown
signs
of
slowing
growth,
in
large
part
because
of
issues
of
affordability,
a
lesser
number
of
graduates
moving
to
London,
fewer
job
opportunities
in
the
capital,
partly
because
of
the
transfer
of
jobs
from
London
to
the
provinces
by
the
government,
and
lower
international
migration
to
the
city
as
a
result
of
the
pandemic and Brexit.
Of
greater
concern
is
that
PwC,
in
a
report
at
the
beginning
of
2021,
estimates
that
the
number
of
people
living
in
the
capital
could
fall
by
more
than
300,000
in
2021,
or
3.3%,
to
8.7m.
What
is
unknown
at
this
stage
is
whether
the
drop
in
growth
is
a
permanent
feature,
accentuated
by
the
apparent
desire
of
some
workers
to
move
outside
the
capital
so
that
they
can
afford
a
larger
property
(with
room
for
a
proper
home
office)
and
garden.
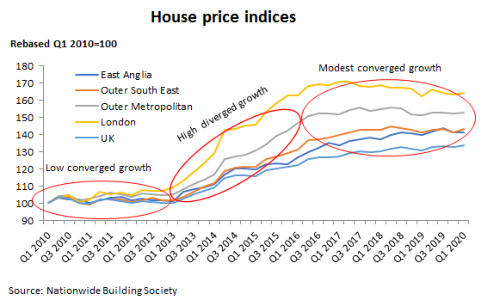
The
chart
below
shows
how
the
southern
UK
markets
have
been
performing
for
the
last
10
years.
In
the
recession
of
20089,
house
prices
fell
significantly,
but
then
stabilised
in
the
southern
UK
regions
(although
continuing
to
fall
in
the
northern
regions)
quite
rapidly
as
interest
rates
were
dramatically
lowered
to
stimulate
the
economy.
As
quantitative
easing
was
introduced
in
the
intermediate
phase
on
the
chart,
hiopuse
prices
rose
very
strongly,
recovering
from
the
falls
in
the
2008/9
period,
led
by
London.
The
final
phase
was
more
modest
growth
generally,
but
with
modest
falls
in
London
prices.
That
might
suggest
that
the
question
of
affordability
was
a
key
reason
for
what
appears
to
be
a
shift
in
demand
from
central
london
to
the
home
counties.
This
conclusion
is
reinforced
by
the
contents
of
the
chart
below.
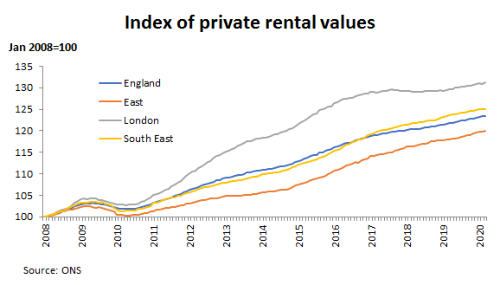
With
some
variation
in
the
first
phase,
the
data
relating
to
rental
values
shows
a
pattern
similar
to
those
of
the
capital
values.
We
view
the
rental
value
chart
as
indicating
demand
for
occupancy,
and
its
difference
to
the
capital
value
one
as
indicating
the
appetite
for
risk
in
committing
to
purchase.
This
shows
some
weakening
in
demand
for
London
in
the
third
phase,
but
still stronger demand than would be implied by the capital value line.
Our
conclusion
from
the
combined
intelligence
in
these
charts
is
that
the
reduction
or
stabilisation
of
demand
was
mainly
due
to
the
affordability
argument
for
central
London
but
that
there
was
also
an
element
of
reduced
demand from a desire to move outwards from the capital.
For
those
who
are
continuing
to
work
in
London,
the
penalty
of
moving
further
out
is
the
increased
cost
of
commuting,
so
the
greater
affordability
of
more
peripheral
housing
is
substantially,
or
even
completely,
mitigated
by
a
reduced
household
net
earnings
cashflow,
although
its
should
be
noted
that
this
a
different
issue
to
the
capital
cost/commitment
one
that
may
be
the
determining
factor
in
the
house
acquisition.
But
as
house
prices
rise
outside
the
capital
and
those
of
London
stabilise
or
afll,
the
affordability
argument
becomes
weaker and this will be the natural stabilisation.
In
the
short
term,
London
prices
are
expected
to
remain
weak
on
that
argument,
and
there
are
risks
attached
to
the
partial
or
wholly
‘working
from
home’
expectation,
which,
at
the
very
least,
will
defer
the
stabilisation
point
to
some
what
further
into
the
future.
For
potential,
but
not
committed,
London
investors,
this
gives
time
to
invest
very
selectively
and
at
what
might
prove
good
prices
in
the
future
as
we
see
an
eventual
recovery
in
London
house
prices.
At
worst,
we
should
expect
no
lesser
growth
in
London
prices
than
in
the
home
counties
in
the
medium
term.
After
all,
it
is
central
London
jobs
that
are
driving
the
demand
for
housing
in
both
London
and the home counties.


Ltd